Tips for Navigating Google Analytics 4’s New Interface
By Jeremy Neilson | November 30, 2023 | Google Analytics 4
Dive into GA4 with our guide to the new analytics interface. Make data-driven decisions with confidence. Get started now!

Google Analytics 4 (GA4) is Google’s newest generation of analytics platform. If you’re migrating from Universal Analytics or are brand new to the service, the interface can look daunting at first. This article breaks down sections of GA4 with some easy-to-use tips for the new interface.
Dashboard and Navigation Menu
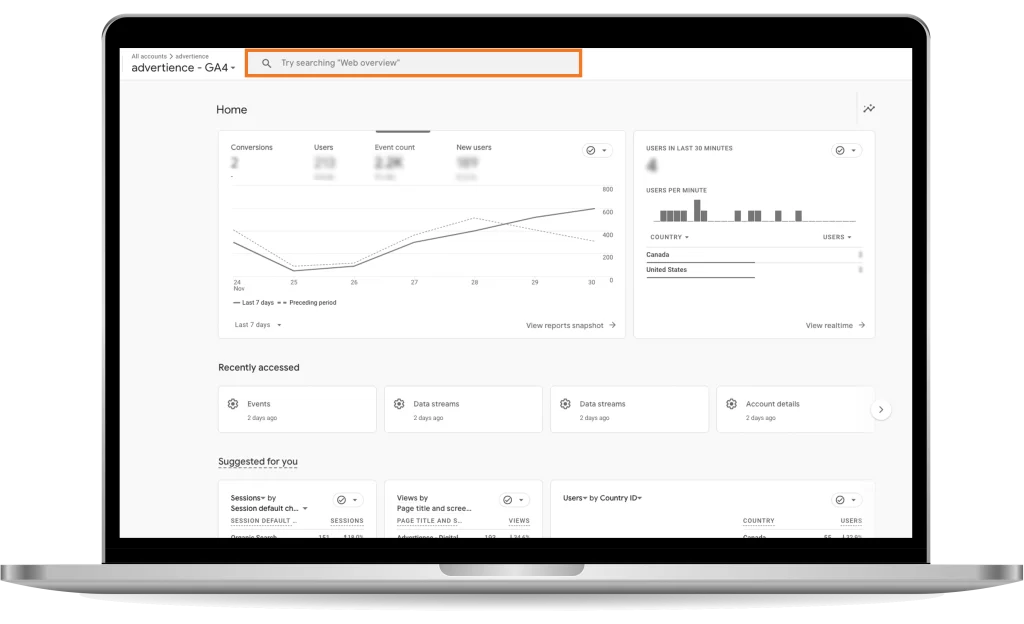
When booting up GA4, you’ll launch into the dashboard of the service. The dashboard, called the Home, will be your primary location for quick access to recently used features, looking at how your performance is doing, and suggesting reports based on your recent activity. It’s fantastic for having a nice overview of performance, but we suggest looking through Reports for any more substantial data you want to analyze.
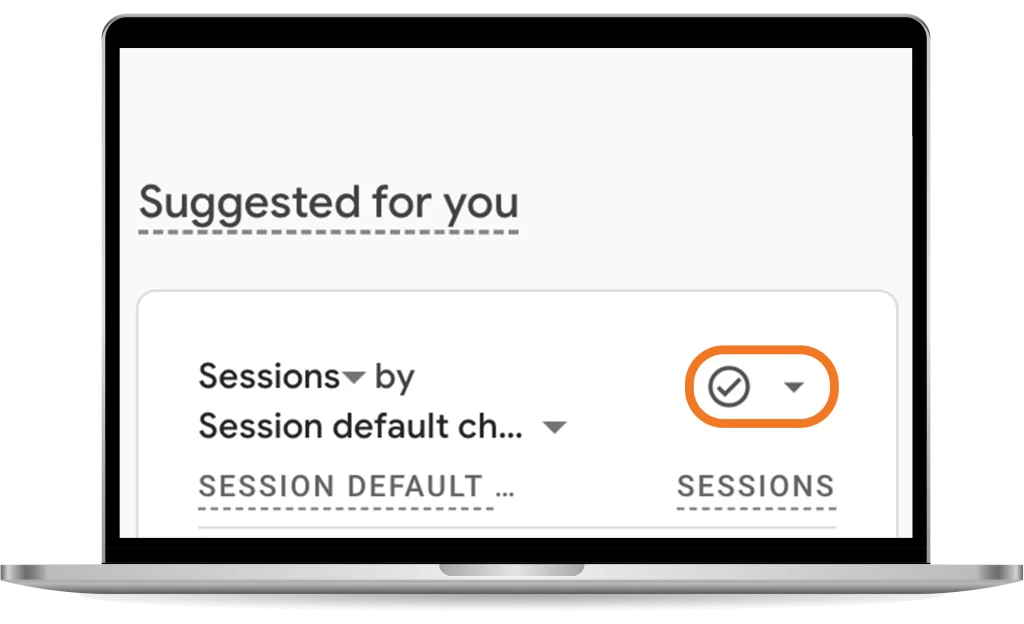
Tip: Leave feedback on suggested reports to improve your Home page
Despite us saying you should look through Reports, Home is great for glances at GA4 statistics. Just below ‘Recently accessed’, GA4 provides small suggested reports where you can tell Google what you like or dislike. The more you do this, the better Google will be at feeding you the most pertinent summaries of your data, making diving into the depths of GA4 Reports less frequent.
Tip: Familiarize yourself with the search bar
GA4’s search bar at first glance can seem kind of mundane, but it is secretly quite powerful. You see, Google has extensive GA4 documentation, and using this search bar essentially acts as a search through both the features in GA4 and the documentation. If GA4 can’t find the setting you’re looking for, there is likely a guide or a developer document that can help you with your needs. Get used to utilizing this search bar, as it’s an easy-access tool that’s located on the same tab as your analytics, so no jumping tabs are necessary.
Tip: Try out analytics intelligence
Analytics intelligence is another AI tool from Google that helps you answer quick questions about your property. It provides you with a tree of potential questions, each under its own category. To find this feature on the Home page, click the sparkling line graph icon in the top right of the page, and you will see it pop up on the right side of the screen.

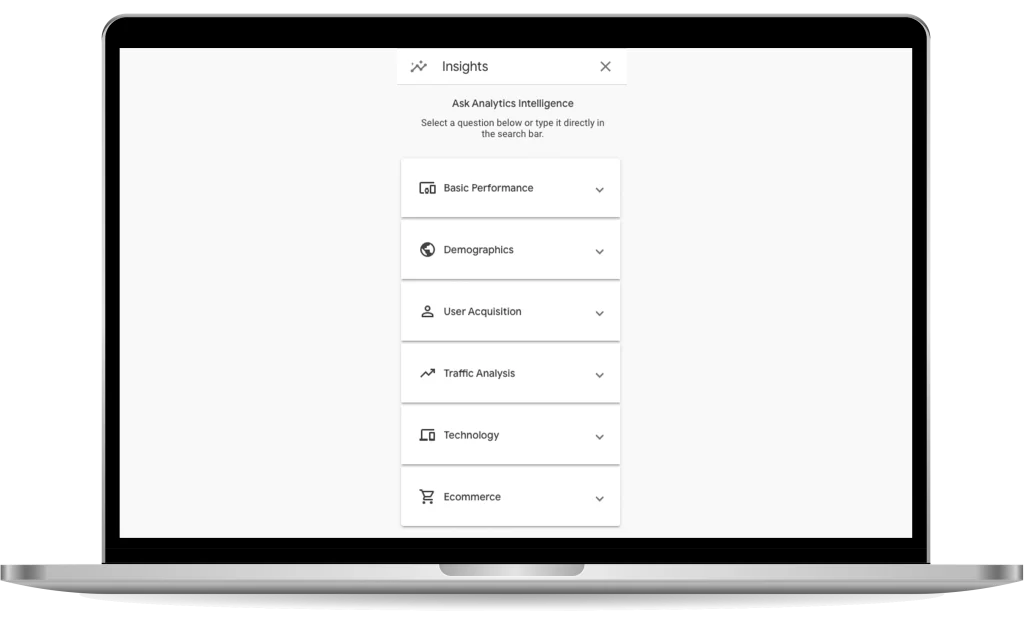
Note: This feature is baked into the search bar as well, but it works much better in its devoted interface.
Reports
This is the meat of GA4. The Reports section, where all collected data gets compiled into various useful and customizable reports, can be very confusing. Here are our best tips for getting a grip on the Reports.
Tip: Don’t get overwhelmed, you don’t need to know everything right away
When starting out with GA4, there is a lot to learn. The Reports section is daunting, but for now, focus on the sidebar. Google has made it so the most important Reports are easy to access from the sidebar, and their default layouts are already incredibly useful. If you feel overwhelmed, ignore all the customization aside from the date filter in the top right. On their own, these reports are fantastic and provide plenty of insight already! The more you work with GA4 and the more you read the documentation, slowly but surely, you will get exposed to all the customization features. For now, don’t worry about it.
Tip: Use the realtime feature!
GA4 warns you when you create a property that it takes up to 48 hours to populate the reports. This is essential to remember when using GA4, that the data you work with in Reports and Explorations are often no younger than 24 hours. However, that doesn’t mean the data isn’t there. This is why you should use the Realtime feature. While you can’t see any of this data in the reports just yet, checking the Realtime section will provide you with user and event data from the last thirty minutes. This allows you to check if your Google Tag is sending events properly, your GTM container is connected, and much more.
Tip: Add additional dimensions to report tables
Once you’re ready for more in-depth analysis, here is a great place to start. In each report screen, there is a line graph, a bar graph, and a table at the bottom. For this tip, take a look at the table. You’ll notice the leftmost column is the name of each entry in the default group that the report presents, and each row is the data for those entries. Here’s the tip: next to the title of the left-most column, is a ‘+’ button. Using it, you can add another dimension/column to the table. This will segment each row just a little bit, giving you further depth to your data without making things that much more complex.
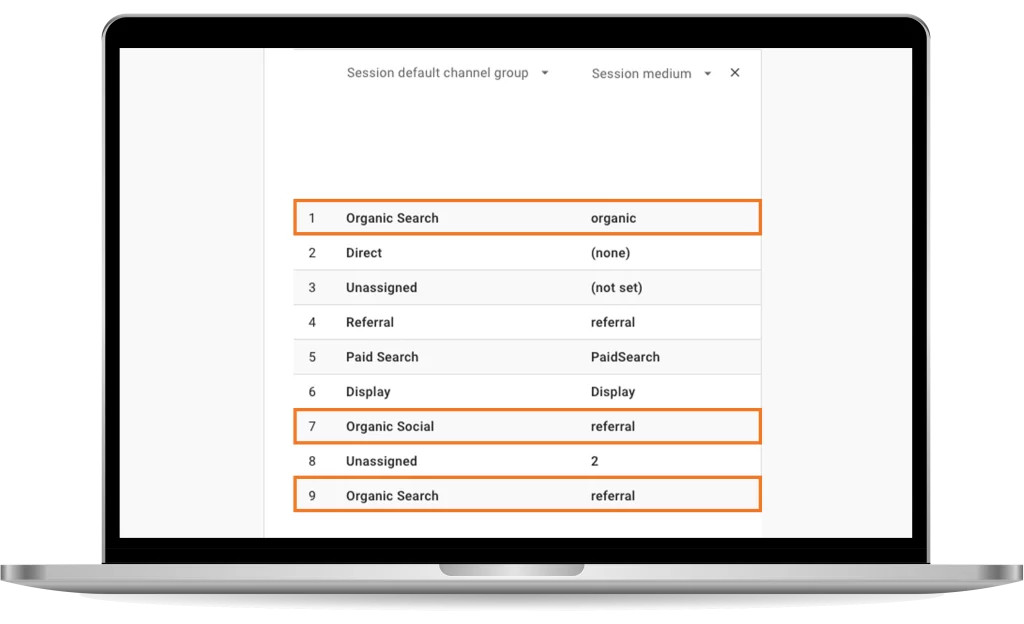
Here’s an example. Let’s look at the Traffic Acquisition Report. The default column is ‘Session default channel group’. If we press the ‘+’ button, we can add the ‘session medium’ to the table.
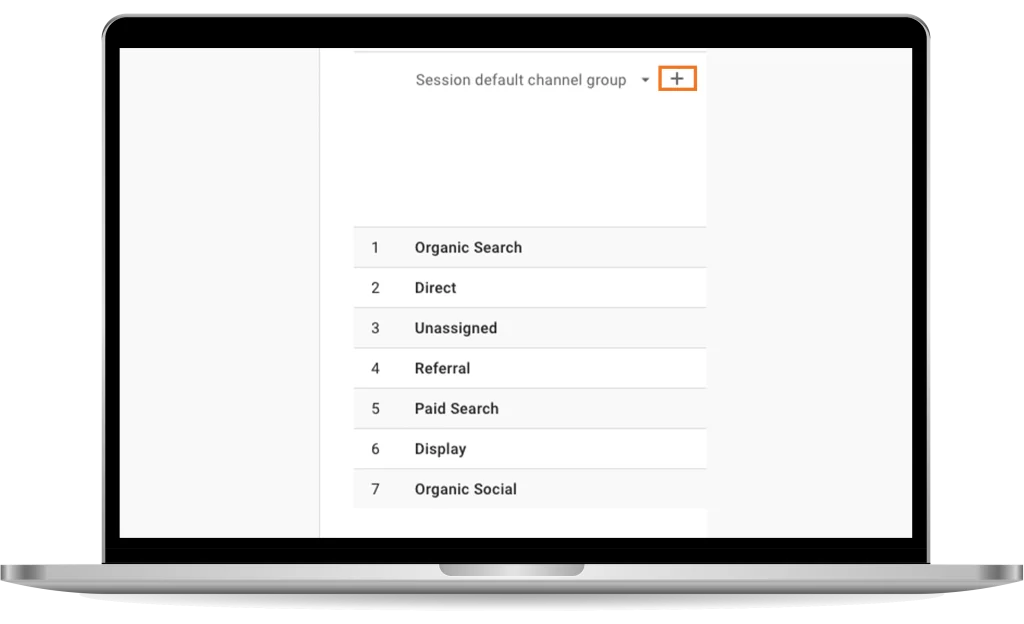
This segments the table and now groups like ‘Organic Search’ in the default column have three entries: two for referral, and one for organic.
Tip: Use Explorations if you’re unsatisfied with reports
While likely the bulk of your time with GA4 will be spent in the Reports section, Explorations is a tool that’s designed to allow you to drill into your data. Essentially, you can build your own reports, with the analysis of your choice, presented in the format you desire. Google provides an easy-to-understand interface for this, and if you feel unsatisfied with the depth of analysis GA4 provides you, definitely get started with Explorations.

Admin Section
Another key section of GA4’s interface is the Admin panel. Located in the bottom left of the navigation bar, the Admin section is all about personalizing your property and setting everything up. Refer to this post we made that covers transitioning to GA4, as it covers a lot of the setup you can do in the Admin Panel.
Here are a couple of tips for the Admin section:
Tip: Remember where your measurement ID is!
Your measurement ID is how you tell your various websites or programs what GA4 property to send data to. It’s located in the Data collection and modification widget, under data streams. All your streams will be listed here, and clicking on them will show you a page that contains, among other things, the measurement ID.

Tip: Get familiar with the data display widget!
Probably the widget with the most settings you’ll spend time configuring while using GA4, the Data display widget has settings for almost all the main elements of your reports in GA4. It’s where you define specific events that your programs will be sending in. Where you determine which events are conversions, how you would like attribution to be configured, and more. Spend time exploring this section, as it will give you a lot of insight into the way GA4 works.
Takeaways
There you go! Some tips to get you started with the new interface Google has developed for GA4. While there is certainly much more to discover when it comes to the GA4 interface, this article sets you up nicely to have a good general awareness of the workspace Google provides you.
For additional information and guides to help you on your journey with Google Analytics 4, whether it’s your first time with the platform or you’re a Google Analytics veteran, check out our other blog posts on GA4.
Wondering if you have your GA4 property set up for success? Have it audited to ensure the data you’re collecting is meaningful and trustworthy.