Measuring and Analyzing User Engagement in Google Analytics 4
By Jeremy Neilson | December 13, 2023 | Google Analytics 4
Boost User Engagement with GA4: Optimize your site and app using GA4’s powerful metrics to elevate performance. Learn more now!

One of the best reasons to utilize Google Analytics 4 (GA4) on your site or in your app is to help you understand what you’re doing right and what could use improvement. Analyzing revenue, pageview patterns, or custom actions is essential for knowing how to keep on top of the ever-shifting landscape of digital media.
The most important aspect of all, however, is likely user engagement, especially for creators on the internet. Knowing that someone clicked on your blog is great, but understanding who stayed to read it all and who kept browsing after only 4 seconds can be the difference between a viral web story and a blog post getting banished to the furthest reaches of the search results screen.
This article aims to help you understand how to most effectively utilize GA4 to provide yourself with the know-how to use GA4’s metrics to measure and analyze user engagement. After reading this, you can start optimizing your page and posts for greater user engagement.
How does GA4 track user engagement?
To begin, let’s understand what Google has in terms of tools for you to analyze user engagement. There are two major parts:
Engaged Session and Engagement Rate:
Before knowing how Google tracks it, let’s see how Google defines engagement in the first place. An engaged session is essentially Google’s way of saying that someone did something meaningful on your website. You can count pageviews, but if half of them are followed by clicking the back button to exit the webpage, it’s no longer a great metric.
If a user does one of the following, Google considers their session as being an engaged one:
- Stay on your page for 10 seconds or longer
- Complete an action resulting in a conversion event
- Sends at least two pageview events
Essentially, if the user spends more than a brief moment on your site, engages with the content on the site, or navigates through multiple pages on the site, Google will tag them as engaged.
Now that we know this, we can define engagement rate. Engagement rate is the percent of total sessions that wind up being engaged sessions. If you have 100 users with one session each, and 95 of them satisfy at least one of the criteria above, your engagement rate will be 95%. Conversely, there is a bounce rate, which is simply the inverse of the engagement rate. In our example, the bounce rate is 5%.
Engagement Time
The name of this metric is pretty self-explanatory. Google measures how long a user is engaged on your website. To be specific, it measures engagement from the moment your session on the site or app begins, until one of the following occurs:
- If it’s an app and the user puts it in the background
- If it’s a website and the user changes focus to another page or app.
- The user closes the tab or app.
- The user’s site or app crashes.
If any of the above occur, Google will count that as the end of engagement time.
Google then appends it as a parameter to the next collected GA4 event so it can be reported to GA4. This parameter is titled engagement_time_msec and is reported in milliseconds.
Here’s an example. Imagine you click on a web page. Once the page loads, the timer starts (the pageview event that gets collected on page load will not have any engagement time appended, as there was no time before the event). You look around for a few seconds (say 4), then scroll down. That scroll event will contain an engagement_time_msec parameter of 4000. Once you’ve scrolled to the bottom, you see a button to continue to the next page and click it after another 3 seconds. The user_engagement event that results from that click will also have an engagement_time_msec parameter, this time 7000, since you were on that page for a total of seven seconds.
Now that you have navigated to a new page on the same website, the timer resets.
Hopefully, these concepts are easy enough to understand. They may seem simple, but they are very powerful when it comes to making big decisions for your site or app.
Now that we understand how it works, let’s dive into how you can use these metrics in GA4.
How to use GA4’s engagement metrics
Seeing and using these metrics is simple since Google is very aware of how powerful they are. The only two sections you will be using these metrics in are the reports and explorations tabs.
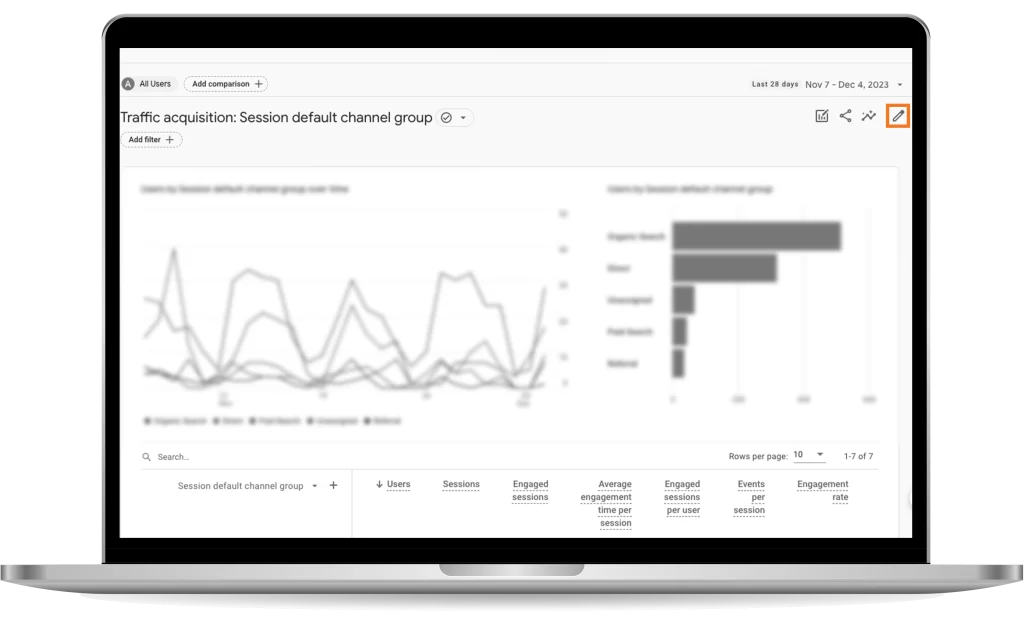
You’ll notice many of the reports in GA4 already feature engagement metrics in them. However, all of them can have them if you like. Google allows plenty of customization options for reports, you just have to click the pen icon in the top right of your report of choice.
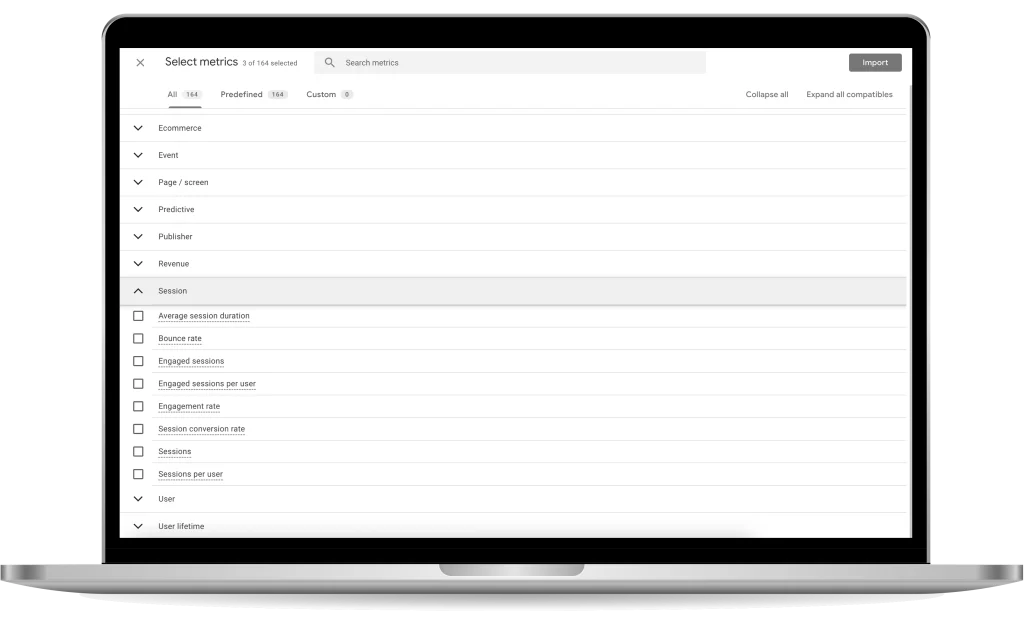
In this tab, click ‘Metrics’, ‘Add metric’, and scroll down to ‘Session’. Under this section are all the metrics related to engagement, as well as several others. Click any of them, then apply the changes and they should be reflected in the report. You can save this as a new report, or replace the current one.

Engagement time populates the metric “Average engagement time per session”, engagement rate populates the metric of the same name, and “Engaged sessions per user” is populated using engagement rate data and user data.
If you would like to include these metrics in your explorations as well, it’s just as easy. Once you’ve created your exploration, click the ‘+’ button on the bottom left, the one for the ‘Metrics’ tab.
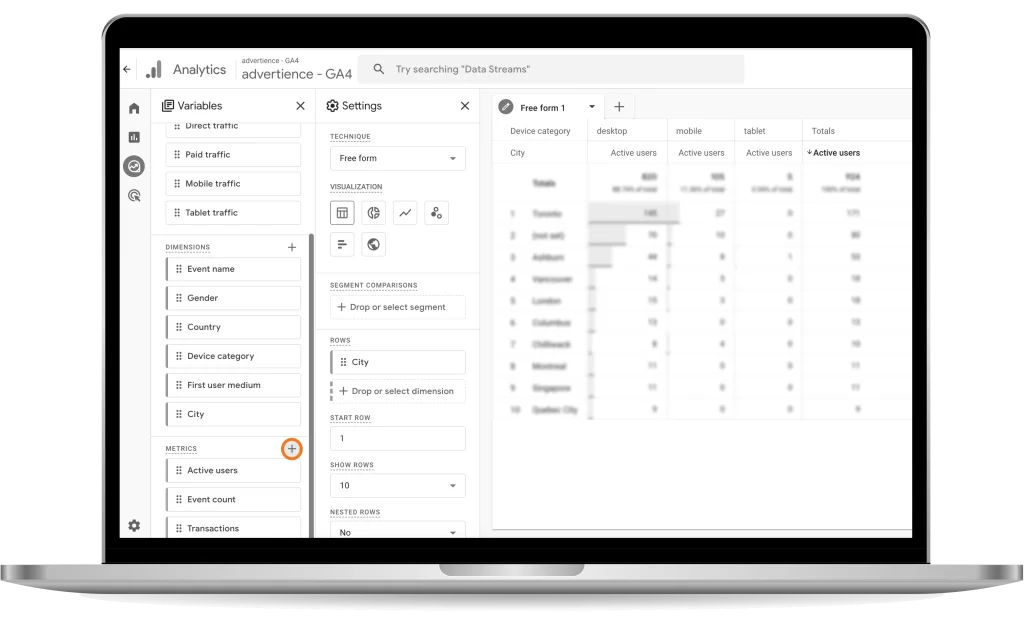
This will create a popup that allows you to select which metrics to include. The metrics in this tab are laid out virtually identically to how they are in the reports section, so simply navigate to the ‘Sessions’ tab and select any of the same metrics we outlined above. Easy!
Takeaways
With these metrics added to any reports, you can customize any other way you would like to get additional information on where the highest bounce rate comes from, which source provides the most engagement, etc. We’ll leave those details up to you, to draw the best conclusions you can from your data now that you have an understanding of engagement metrics!
You’re all set to go with engagement metrics! They are essential to having a successful webpage or application, so including them in your reports and analyses is of utmost importance. Optimizing engagement time and engagement rate will go a long way to boosting your website’s performance.
For additional information and guides to help you on your journey with Google Analytics 4, whether it’s your first time with the platform or you’re a Google Analytics veteran, check out our other blog posts on GA4.
Wondering if you have your GA4 property set up for success? Have it audited to ensure the data you’re collecting is meaningful and trustworthy.