How to Track 404 Error Pages in Google Analytics 4 (GA4)
By Jeremy Neilson | October 12, 2023 | Google Analytics 4
Dive into 404 error insights with GA4 Explorations. Master Dimensions, Metrics & more to optimize your site. Decode website data now!

Exploring 404 Error Pages
404 pages are used in websites to inform a user that the connection was unsuccessful, that the server’s response code was 404 (error), rather than 200 (success). They are essential in mitigating user confusion, and for helping redirect users to their correct destination. Certain 404 errors are inevitable—like attempting to access a non-existent webpage—but others are avoidable, and GA4’s Explorations can help you with discerning between the two.
Understanding Explorations in Google Analytics 4 (GA4)
To begin, explorations in Google Analytics 4 (GA4) are used to delve deeper into your website data, to draw more specific conclusions from your customers’ behaviors.
In this guide, there are a handful of terms used in the Explorations editor that will be of use:
- Dimensions, Rows and Filters: These are what we want to analyze. They are the rows and columns of a table, the breakdown category in a chart, or the filter for your report’s data.
- Metrics and Values: Metrics are what provide data to your exploration. Adding your metric to the Values section adds the data to your report.
Creating an Exploration for Your 404 Page
Before creating an exploration, navigate to your property’s explorations page, by clicking the Explore button on the sidebar in GA4.
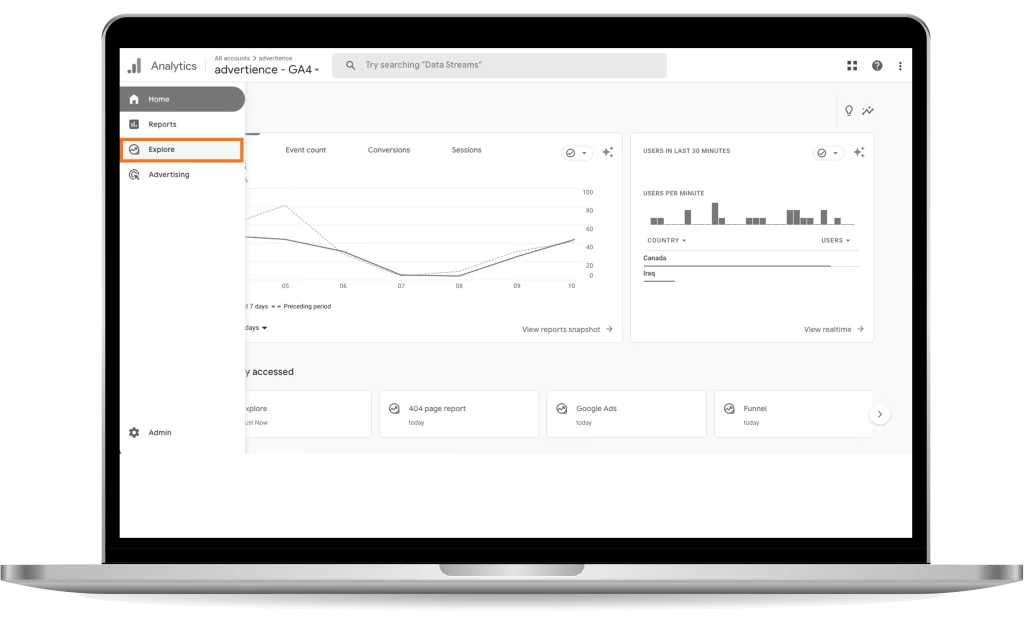
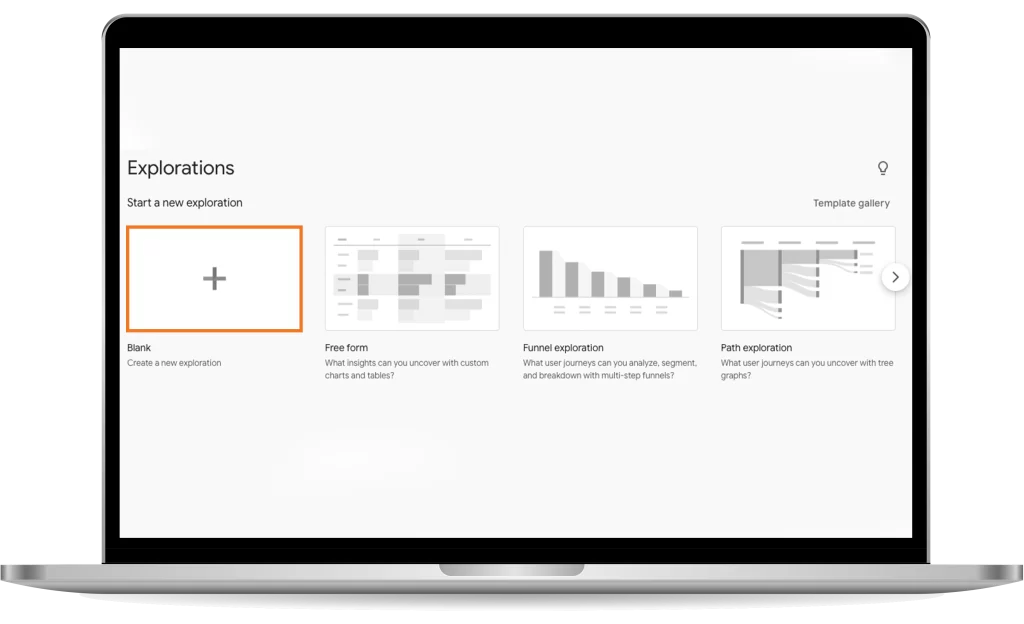
On this page, you should see these options for new explorations, and below that, any explorations already created for this property, if any exist. Start with a Blank Exploration, the option furthest to the left.
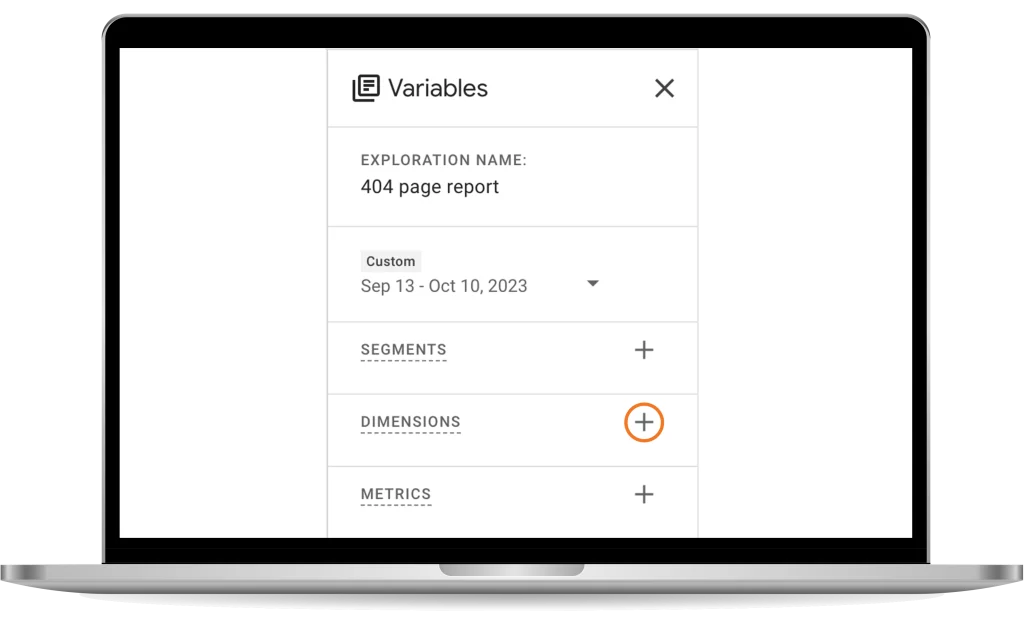
Welcome to the Exporations Editor! First things first, give the exploration a name, something like “404 page report”.

Now, start filling out some of the sections outlined at the beginning of this guide. First, under the Variables tab, there are 3 dimensions to add to the exploration.
01
Click the ‘+’ icon next to Dimensions.
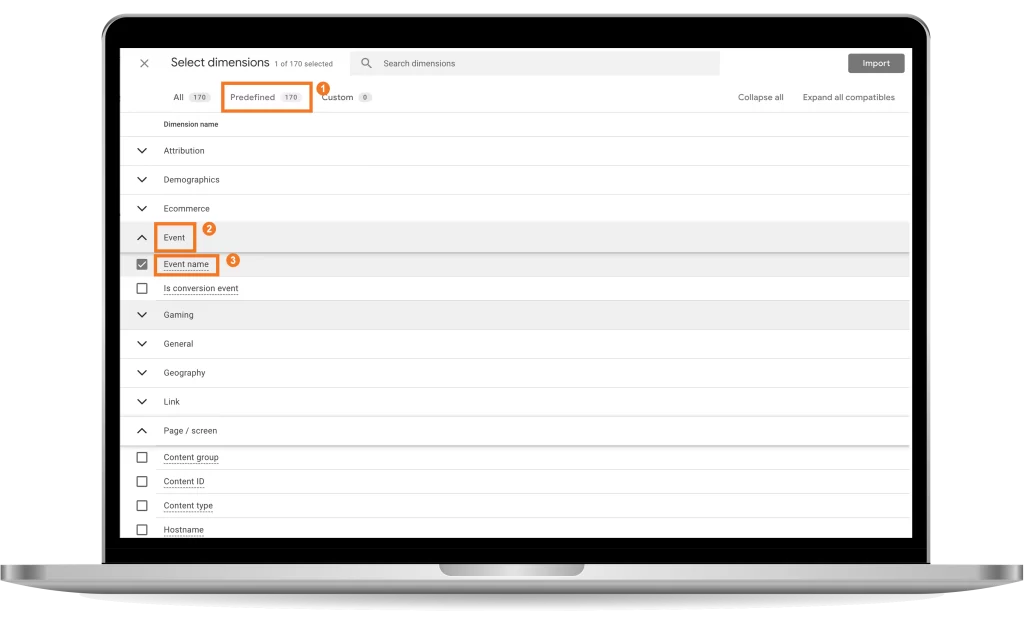
02
Next, direct yourself to the Predefined tab in the page that pops up. Under Event, select ‘Event name’.
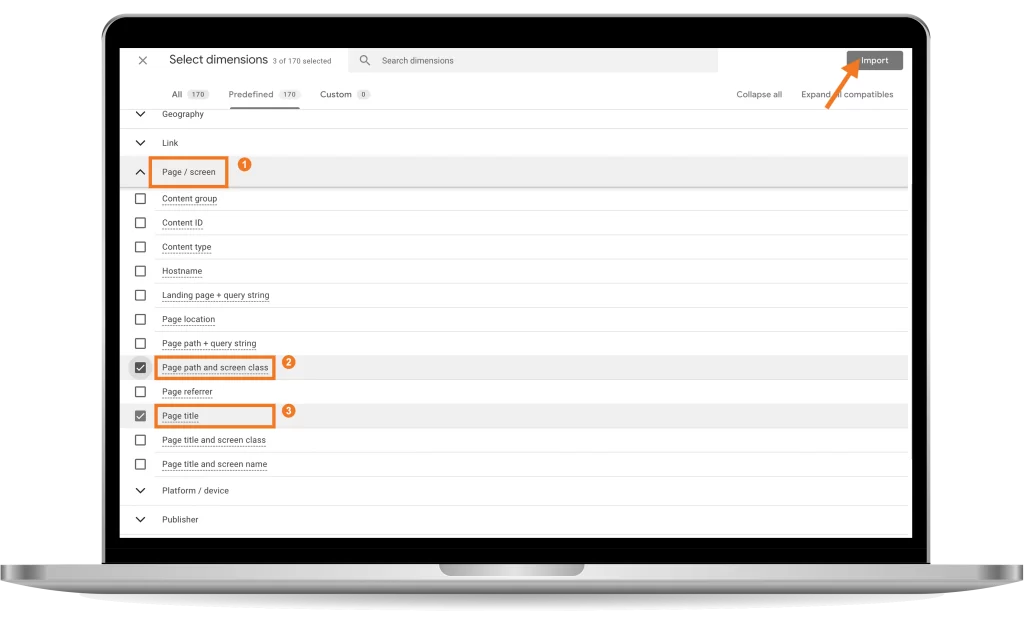
03
Under Page / screen, select ‘Page path and screen class’ and ‘Page title’. Click Import in the top right.
Before building the exploration, import one more thing in the Variables tab. Click the ‘+’ next to Metrics. Like the section above, click Predefined, then select ‘Event count’ under Event. Finally, click Import.

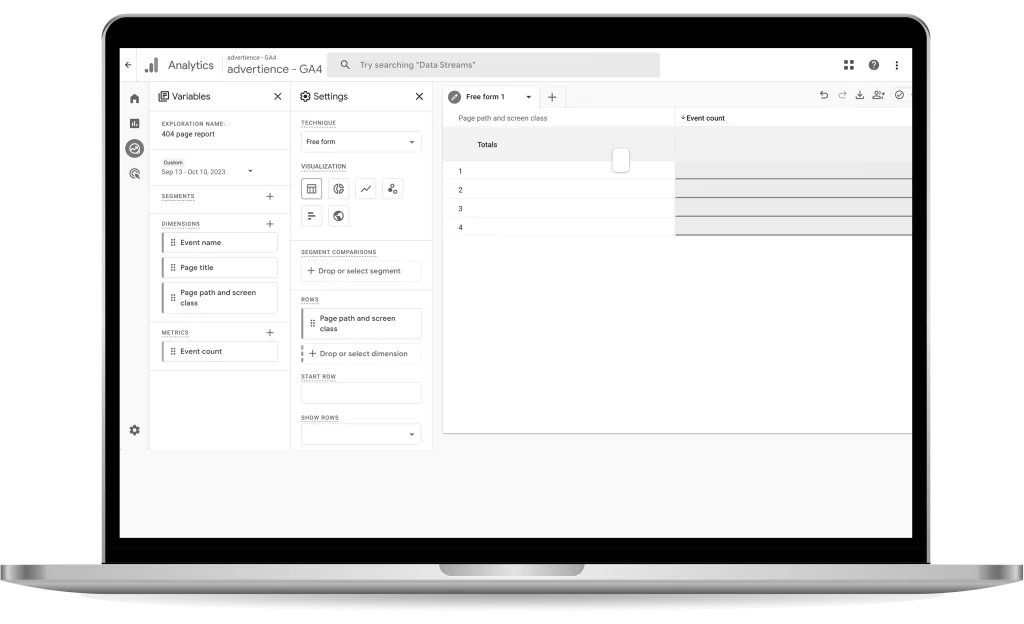
Moving on to the Settings tab. For this exploration, leave the technique as Free form, and the visualization set to Table.

Now, under Rows, select Drop or select dimension, and add ‘Page path and screen class’ from the dimensions you imported earlier.

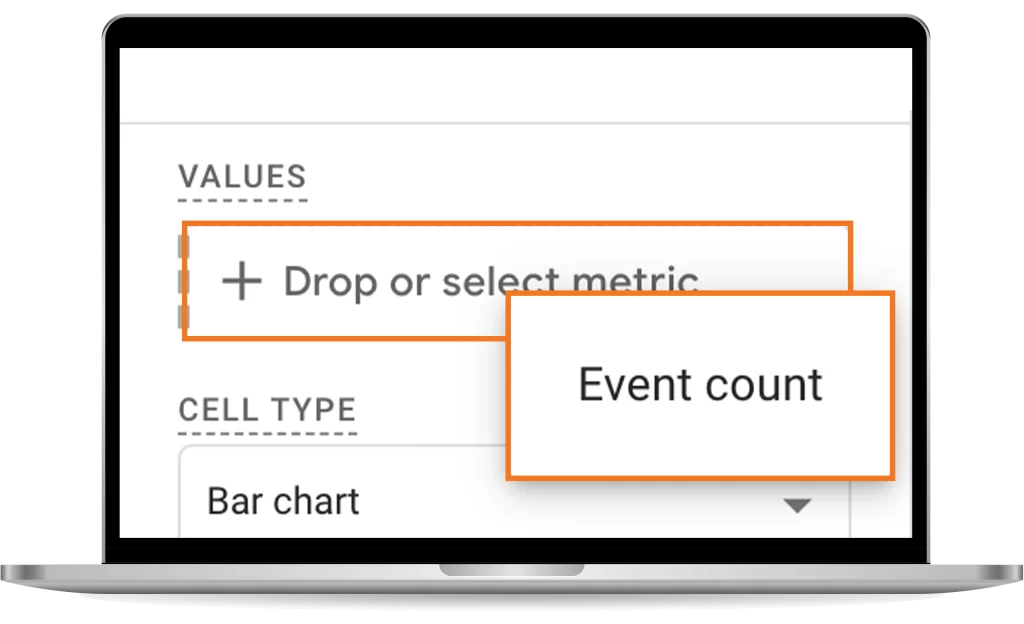
Scroll down to Values, select Drop or select metric, and add ‘Event count’.
In the bottom section, Filters, there are two to add. For each, start by clicking Drop or select dimension or metric.

For the first, choose ‘Page title’. A ‘Conditions’ section should appear, and in it, set the first box to ‘contains’. The second box’s value will vary by website. Check your website’s 404 page, and look for the page title that appears on the tab at the top. This should be a unique title for the 404 page, something like ‘Page not found’.

Whatever this title is, put that as the value in the second box. This will filter all the data so that it only refers to events in the 404 page. Finally, click Apply.

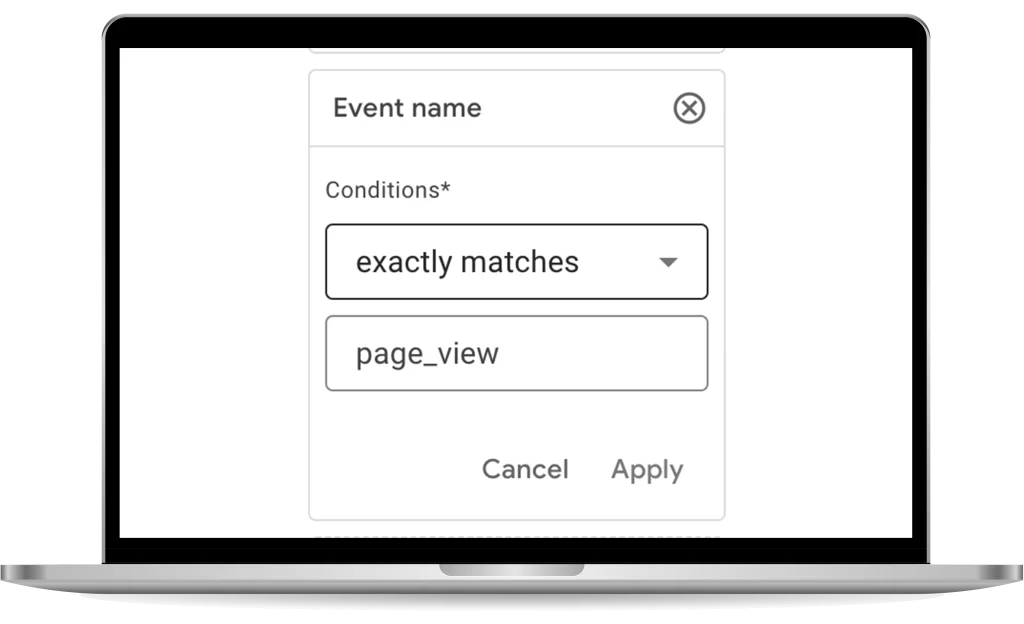
For the second, choose ‘Event name’. In the ‘Conditions’ section, select ‘exactly matches’ for the first box, and ‘page_view’ for the second. This will filter the data so that the only events that are counted are page views, or when users are directed to your 404 page. Click Apply.
Important note: If your 404 page does not have a unique title, ask your developer to make that change. It is best practice to uniquely identify your error page. If that is not possible, having them push a custom event titled ‘404_error’ (or similarly) to GA4 when your 404 page loads can also work. In that case, simply change the second entry in your first filter to be that custom event, rather than ‘page_view’.
At this point, Google Analytics 4 (GA4) should have populated your exploration on the right-hand side of the Exploration editor. In the top right of the editor, there are icons that allow you to share and export this exploration. Additionally, this exploration will now appear in the Explore tab for this property.
The final exploration displays two columns:
- Page path and screen class: This describes the website URL or mobile screen class that the user came from when the 404 error occurred.
- Event count: The number of times a 404 occurred from that URL or screen class.
The beauty of the exploration tool in GA4 is its ability to provide insights into the most frequent 404 error occurrences. These 404 errors can act as impediments to a seamless user experience. By analyzing the origins of these errors, businesses can pinpoint broken links, missing pages, or website migrations gone wrong. Addressing these 404 errors will not only improve the user experience but also potentially increase the website’s SEO rankings. It is recommended that businesses periodically conduct a Google Analytics 4 (GA4) audit focusing on 404 errors. This ensures the website is free from broken links and offers a hassle-free navigation experience to its users. Furthermore, it helps validate that your redirect strategies are working correctly and that users are being directed to the appropriate content.