How to Analyze Conversion Rate Metrics in Google Analytics 4 (GA4)
By advertience | August 11, 2023 | Google Analytics 4
Delving into Google Analytics 4 (GA4)’s features, this guide highlights the importance of ‘Sessions’ and ‘Users’—two central metrics of the platform. Understanding these fundamental concepts serves as a foundation for more advanced analyses and informed decision-making. Understanding Sessions and Users in Google Analytics 4 (GA4) Session: In Google Analytics 4, a session starts when a…

Delving into Google Analytics 4 (GA4)’s features, this guide highlights the importance of ‘Sessions’ and ‘Users’—two central metrics of the platform. Understanding these fundamental concepts serves as a foundation for more advanced analyses and informed decision-making.
Understanding Sessions and Users in Google Analytics 4 (GA4)
Session: In Google Analytics 4, a session starts when a user launches your app or accesses a page/screen, assuming there’s no ongoing session (for instance, if the previous session expired). Typically, sessions end after 30 minutes without user activity, but this duration is modifiable, and sessions don’t have a predetermined end time.
User: In Google Analytics 4 (GA4), three main User metrics exist:
- Total Users: Total number of unique users who logged an event.
- New Users: Number of users visiting or using your app for the first time.
- Active Users: Primary user metric in Google Analytics 4 (GA4). Number of unique users on your website or app. An active user is identified by an engaged session or when Google Analytics 4 (GA4) collects specific events or parameters from websites, Android apps, or iOS apps.
Google Analytics 4 (GA4)’s Active Users metric has an edge over Universal Analytics’ Total Users because GA4 better captures user engagement over time. By considering users who interact across various devices, it paints a fuller portrait of user activities. In comparison, both metrics offer insights, but GA4’s Active Users gives a truer measure of user engagement over time, proving more useful for businesses and marketers aiming to enhance engagement on their platform.
Session Conversion Rate vs. User Conversion Rate
Session Conversion Rate: It is calculated by dividing the number of conversions by the total number of sessions and then multiplying the result by 100 to obtain a percentage. This metric essentially answers the question, “Out of all the sessions, how many resulted in a conversion?”
User Conversion Rate: It is determined by dividing the number of unique users who converted by the total number of unique users and then multiplying the result by 100. This metric addresses the question, “Out of all the unique visitors, how many executed a conversion action at least once?”
In essence, while the session conversion rate gives insights into the effectiveness of individual visits, the user conversion rate provides a perspective on how many of the total unique users took the desired action.
For a clear understanding of your audience, traffic, and conversions, it’s advisable to use both metrics together. Additionally, the specific report or analysis in which you incorporate one or both metrics is vital. For instance, if most of the metrics and dimensions focus on session-level performance, it’s logical to include a session conversion rate metric.

Important note: When you try to determine the session conversion rate by simply dividing the total conversions by the number of sessions, the figures won’t align. This inconsistency arises due to the distinct methods used to calculate both metrics.
- The ‘Conversions’ metric includes all conversion events.
- The conversion rate is determined by the number of sessions in which conversions occurred.
For instance, if a user initiates four separate conversion actions within a single session, it’s recorded as four conversions. However, it’s only recognized as one session with a conversion. So, the more varied conversion actions you establish, the larger the potential difference in the report.
Also, it’s acceptable to label a particular ‘page_view’ as a conversion. However, treating every ‘page_view’ incident as a conversion can significantly distort your results.
Analyzing the Conversion Rate of Specific Events in GA4
01
Open a standard report and click on the pencil icon at the top-right corner to edit.

02
Click on ‘Metrics’ and add ‘Session Conversion Rate’ and ‘User Conversion Rate’, then click ‘Apply’.


03
Click on the dropdown menu beneath any of the conversion rate headers and choose the event you prefer. Sort channels on conversion rate ‘Form Submission’.

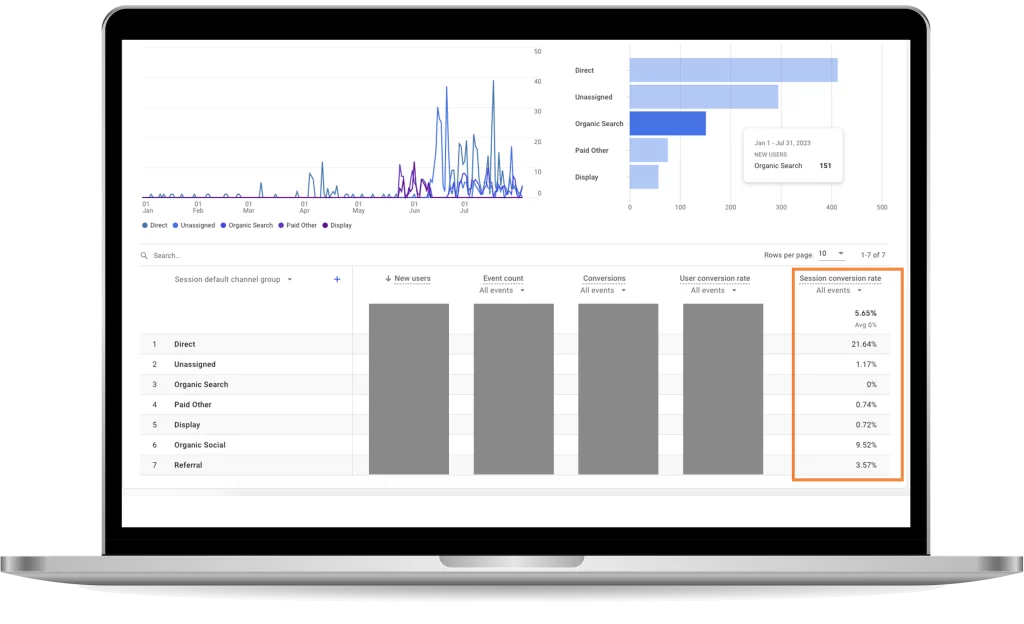
By default, the shown conversion rates are computed for all conversion events. Choosing an event from this list allows you to evaluate the conversion rate of that particular event.
04
Select ‘Form Submission’ under Conversions.

Your report is now available! The count of conversions offers additional context to the ‘session conversion rate’ for each channel.
In Google Analytics 4 (GA4), after marking events as conversions or setting up tracking, the conversion rate will show up automatically. To get a deeper understanding, add this data to your reports. Remember, periodic Google Analytics 4 (GA4) audits and consulting can help ensure accuracy and optimize your insights.
Advertience is a specialized Google Analytics 4 (GA4) audit and consulting agency based in Vancouver and Toronto. We deliver in-depth GA4 audits worldwide, ensuring organizations have a reliable data foundation for making informed business decisions. Whether you’re in need of a comprehensive audit or dedicated consultant services, we’re here to help.