Google Analytics 4’s (GA4) Reports: What’s new?
By Jeremy Neilson | November 28, 2023 | Google Analytics 4
Stay updated with the latest GA4 Reports features. Unlock new insights for your website’s analytics. Learn more in the article!

Google and Report Updates
As part of their support for Google Analytics 4 (GA4), Google has been consistently providing updates and new features to the platform almost every week. Many of these have been additions to the reports feature. Reports are fundamental to GA4, and provide much of the customizability of GA4. With so much to learn, it can be overwhelming having so much new content being released. This article dives into all the recent Reports updates from Google, and what they mean for users, starting with the most recent.
October 2, 2023: Exclude Google signals data from reports and explorations
Launched in 2018, Google Signals is one of Google’s solutions for associating your GA4 user data with other data those users have accumulated in their Google accounts. While this can help get a better idea of demographics and audiences in your reports, Google often has to withhold information in those reports from you, for various safety and privacy reasons. This specifically occurs for Blended or Observed reporting identities, as they include Google Signals data in their chain of identity determination.
If you’re tired of hitting data thresholds because of this feature, Google has added the option to turn off Google Signals in reports, but not in the actual data collection. If that sounds appealing, you can find the option in Admin -> Data Collection in your GA4 property.

September 19, 2023: Checkout journey report
This report can be found in Reports -> Life Cycle -> Monetization -> Checkout journey in your GA4 property. Here, you can see the steps towards a checkout that users take. It shows the number of people who reached each step and the percentage.

Google’s main focus for adding this report is to help you find bottlenecks in your checkout process. For example, unexpected fees or shipping costs can cause users to abandon the purchase in the add payment section. This report will show you the numbers to prove people are leaving specifically during that step.
You won’t instantly have all the data in this report, however. In order to populate it, you must have e-commerce events implemented on your site. These events specifically:
- Step 1: begin_checkout
- Step 2: add_shipping_info
- Step 3: add_payment_info
- Step 4: purchase
You can view the events used at each step by clicking the ‘View funnel steps’ button.
August 17, 2023: Behavioral modeling in path and funnel reports
A smaller update, Google now allows user behavior reports to fill in missing gaps using Google’s behavioral modeling. Here’s an example. If any of your website users decline cookies, GA4 will have trouble collecting certain data, and your report will not contain their data. However, if there is a significant portion of users who do accept cookies, Google can now use that data to help model what the likely behavior of those who didn’t accept cookies was, resulting in a filled-out report that is still very likely to be accurate.
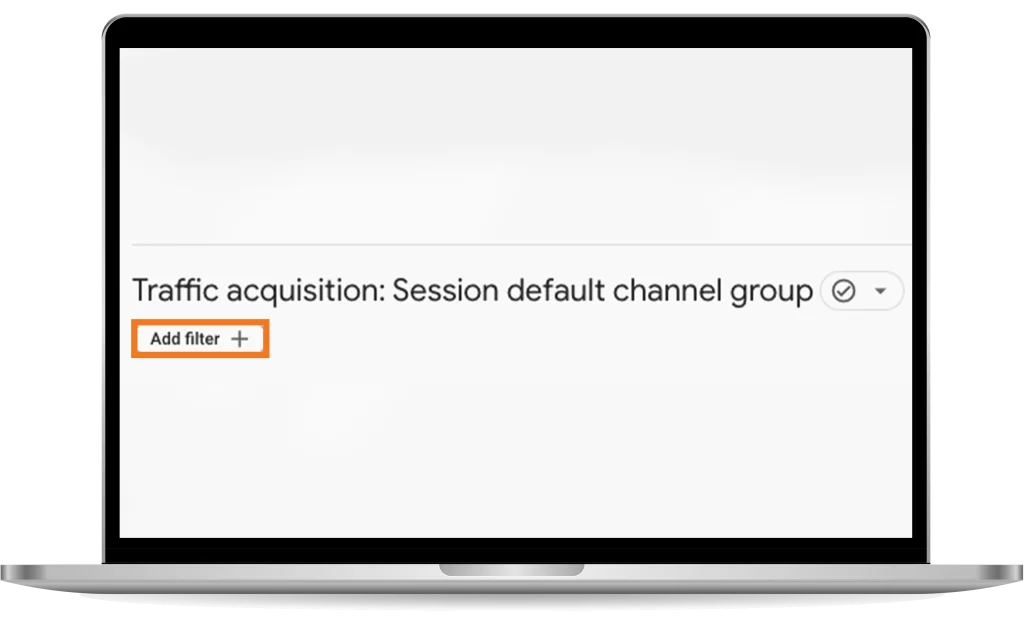
August 4, 2023: Match types, like regex, in Reports
A huge new feature, match types are essentially a brand new way to filter data in any of your reports. To see this, click the ‘Add filter +’ button just under the title of a report, and you’ll see a window pop up on the right of the screen.
This new addition allows you to select up to five out of the dozens of dimensions in GA4, and give values that they should contain, exactly match, begin with, or even match a regex.
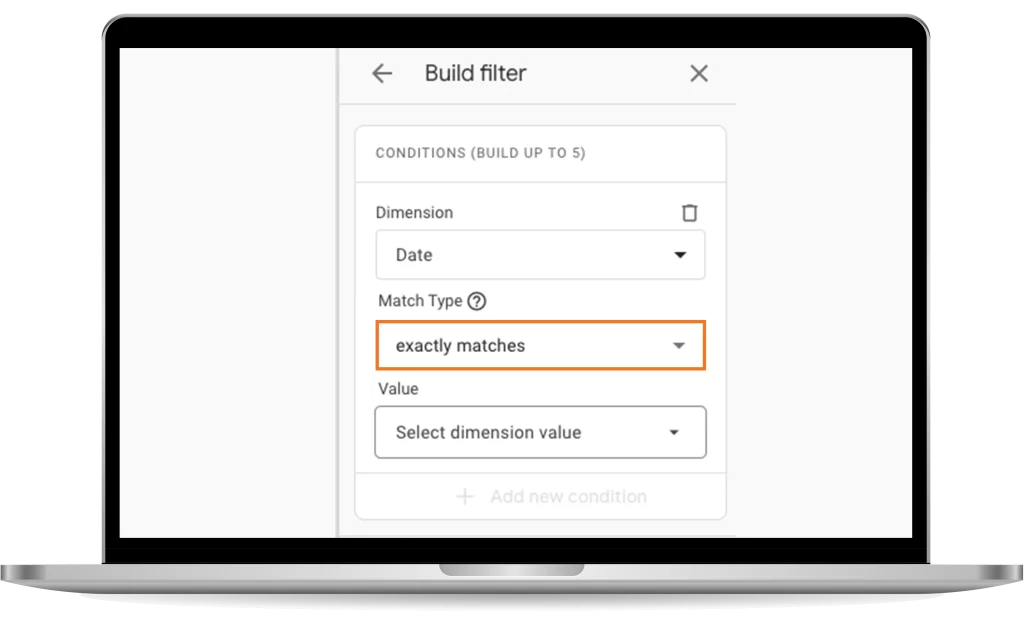
This is fantastic for anyone who wants more detail in their reports. You can answer more specific questions about every dimension of your data, and find trends that were previously difficult to see.
August 1, 2023: Audiences report
This report functions like most others in GA4. You can find it under Reports -> Users -> Attributes -> Audiences.
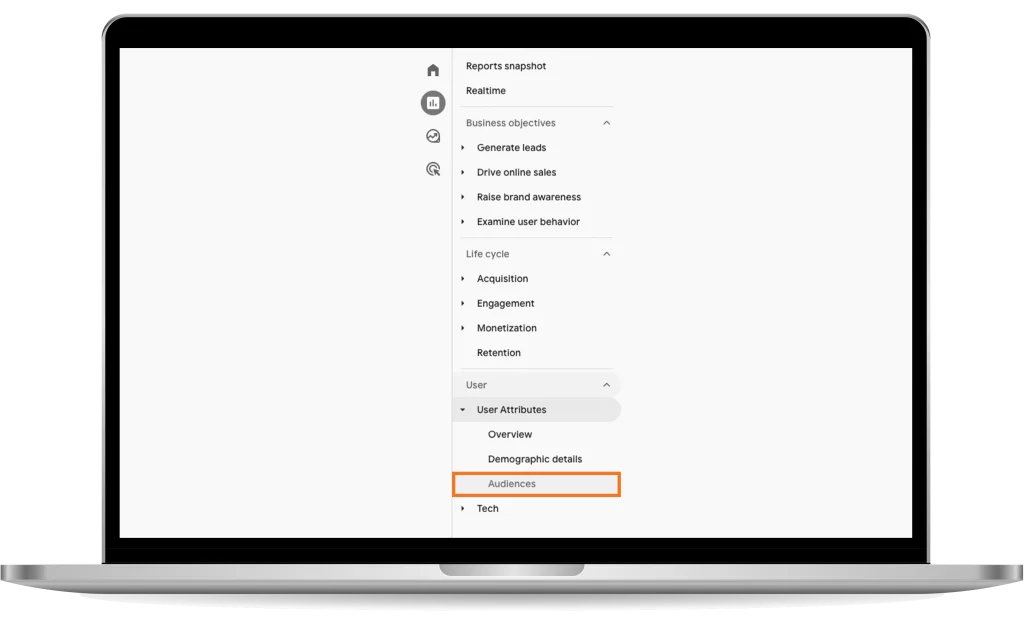
Essentially, it provides data on all the audiences you have defined in your property. The graph’s dimensions are number of people in each audience over time. You can select date range, and click audience names at the bottom for individual reports.
Takeaways
GA4 is constantly being updated. Every week, some part of the service sees some change. Reports are one such feature that seems to be the focus of a great many of these updates. Staying on top of those updates is challenging, but doing so can be extremely rewarding to your website’s analytics. As seen above, some updates are smaller, adding a new type of report or making a change for certain kinds, but many have wide impacts on the GA4 space.
For additional information and guides to help you on your journey with Google Analytics 4, whether it’s your first time with the platform, or you’re a Google Analytics veteran, check out our other blog posts on GA4.